JVL Wealth Strategies moves office, positions for future growth
December 13, 2021
JVL Wealth Strategies hires wealth manager
March 9, 2022
JVL Wealth Strategies moves office, positions for future growth
December 13, 2021
JVL Wealth Strategies hires wealth manager
March 9, 2022

2021 YEAR END REVIEW


US MARKETS


2021 was another strong year in the equity markets, with most stock indexes up double digits. Bonds struggled to break even, given the interest rate environment. Overall, balanced portfolios performed very well.

The following is a look at the past two years in the U.S. markets:
 

INTERNATIONAL MARKETS


International stock markets again trailed the U.S. markets.
 

S&P 500


The S&P 500 price only index (excluding dividends) started slowly but began its uptrend mid-March and with the exception of a couple of minor draw-downs continued its upward trend.
 
Looking back over the last 22 years, the S&P 500 price only Index (excluding dividends) has experienced three bear markets, yet has gained 224% from where it began on January 1, 2000.
 
The S&P 500 total return (including dividends) was another positive year. Looking over a longer time period we see that the S&P 500 has been positive in 71 of the past 96 years meaning that 74% of those years (1926 – 2021) have shown positive returns. That percentage holds for the 2000’s as well, with 17 of 22 years showing positive returns (2000 – 2021).
 

GPD


The U.S. economy continued to adjust to its pandemic hangover. Employee shortages and supply chain issues adversely affected certain segments of the economy more than others. Overall, initial projections are for a 5.6% increase in GDP for 2021. In dollars, the U.S. GDP got back to its pre-pandemic 2019 levels. However, measuring from September, 2019 to September, 2021 the economy only grew 1.5% over two years! Economists are mixed in their projections for 2022 but most are in the 2.5% to 3.5% range. The biggest question mark is the timing of the recovery on a broader scale.
 

MANUFACTURING


We continue to keep an eye on the PMI reading (Purchasing Managers Index) which bottomed out at 42 in April, 2020 due to the mandated shutdowns, before charging back to record 19 consecutive months of readings above 50. During 2021, readings were above 58 for the entire year. When the index is above 50 it signals an expansion in the manufacturing sector, while a reading below 50 indicates a contraction.


The capacity utilization rate stayed above 75 for the entire year. This signals that factories, while busy, have the capacity to increase production should demand rise.


Inventory to sales ratios confirm the effects of the pandemic. Retail inventories to sales ratios are 22% below their 10-year averages, indicating strong sales and low inventory supply, while manufacturing inventories are above their 10-year averages as manufacturers are pre-buying raw materials due to delivery timing issues. Wholesale inventories are at their 10-year averages.
 

EMPLOYMENT


Employment continued to be the dominate story of 2021. After reaching a record number of people employed (152 million) and historical lows in the unemployment rate (3.5%) at February, 2020, the pandemic shut downs brought employment to a halt. The economy lost 22 million jobs in March and April, 2020 and have only added back 19 million of those jobs (6.5 million in 2021). That means there are 3.5 million less Americans working since the pandemic hit.

The official unemployment rate started the year at 6.7% and ended at 3.9%. The U6 rate, which is the broadest measure of those unemployed, started at 11.7% and dropped to 7.3% at year end.
 
One way to analyze the employment situation is to look at the raw data. There are 261 million people in the U.S. of working age. Of those, 161 million are “wanting to work”. Of those 161 million persons wanting to work, 152 million are currently employed, leaving 9 million unemployed. Another way to look at the data is that there are 100 million people of working age who do not “want to work” – highest in history - (age, in school, stay at home parent, etc.) plus another 9 million people who want to work but are not employed. Looking over the past 5 years (2017 – 2021) the U.S. added 6.4 million people of working age, 5.4 million who do not “want to work”, thus adding only 1 million people to the eligible labor force. The number of unemployed has increased by 1.7 million, resulting in 700,000 less people working in 2021 than were working in 2017!

 
We can also look at the data to view the percentage of individuals wanting to work with the percentage actually employed. Currently, 61.7% of the U.S. population wants to work (down from 66% 10 years ago) and 58.4% are working. The big question is whether this downward trend will continue post pandemic.
 

HOUSING


Monthly new home starts averaged 1.6 million per year with 70% single family homes and the balance multi-family. This is the highest rate since 2007.


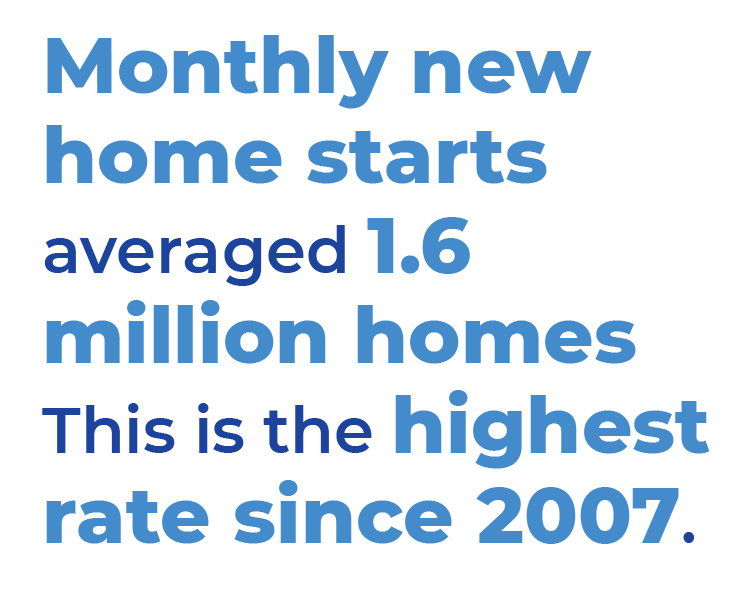
Sales of existing homes followed the same pattern, dropping significantly during the shutdown, but rebounded to end the year on a 6.7 million per year pace due to the pent-up demand.
 
The interest rate on a 30-year fixed rate mortgage continued to promote home sales. Rates started the year at 2.67% and finished the year at 3.11%. These rates are low by historical standards.
 

HOUSING


Providing support to the housing sector is that home prices continue to increase. In 2021, the average home price increased 17% over last year. Home prices are 101% above their 2012 lows. The following chart tracks the year over year percentage change in home prices.
 

CONSUMER SENTIMENT


As one might expect, consumer sentiment, as measured by the University of Michigan monthly survey, remained low, ending the year at 71. Concerns over the lingering pandemic, inflation and employment continue to weigh on consumers’ minds.
 

CONSUMER SALES


Retail sales were one of the bright spots during the year as retail sales increased 19% over last year as consumers acted on the pandemic induced pent up demand.


Sales of new vehicles took a big hit during the year as supply issues left most dealership lots without vehicles to sell. New vehicle sales dropped to an annualized pace of 13 million vehicles during the end of the year down from an annual pace of 17 million in January.
 

INTEREST RATES


The Federal Reserve retained the Fed Funds rate at almost zero throughout the year. Longer term rates (10-year Treasury rates) are determined by market forces and ended the year at 1.47%. The Fed has indicated they plan to start raising rates during 2022 in response to lingering inflation concerns.
 

INFLATION


The major story heading into 2022 is inflation. Both headline inflation (which includes food and energy) and core inflation (which excludes food and energy) rose substantially during the year. Headline inflation rose from 1% to 7% while core inflation rose from 1% to 5%. We have not seen inflation this high in over 40 years.
 

OIL


The price of a barrel of oil started the year at $51, rose to a high of $86, and ended the year at $78. The current price is a headwind to consumer confidence.

US DOLLAR


The U.S. dollar strengthened against other world currencies during the year, which makes imports less costly to U.S. consumers but makes our exports more expensive to overseas consumers. A Fed tightening of interest rates in 2022 should strengthen the dollar even further.


STOCKS


Corporate profits are a large driver of the stock market. The S&P 500 earnings increased 65% over the pandemic stricken 2020 earnings. 2021 4th quarter earnings are projected to be up 29% over 2019 4th quarter (pre-pandemic) earnings. Projected 2022 earnings are expected to increase 9% over 2021.
 
The above rise in corporate profits caused the S&P 500 Price to Earnings (PE) ratio to drop from 31 to 22 during the year. That puts current valuations back in line with both the long-term 10-year and 20-year averages.
 

BONDS


The bond market is a totally different market. Interest rates have remained low and provide a tailwind to owning stocks. For investors, with inflation running at 7%, owning a 30-year U.S. Federal bond paying 2% makes “safety” an expensive holding.
 

RECAP


During 2021, the markets returned to a more normal trend. We stayed on course with our investment strategies in spite of the worrisome headline news. Our exposure to various alternatives to the traditional bond market while maintaining our stock exposure rewarded our clients with another very good year!

At JVL Wealth Strategies our mission is to create a financial strategy that helps our clients withstand the ups and downs of the markets. Our role is to prepare our clients for all economic and market conditions. Our planning and strategies can withstand market uncertainties. While we cannot control the news or the events and actions that affect the markets around the world, we can control the strategies and the planning to prepare our clients for the uncertainties the world has to offer.

We deeply value the trust our clients place in us. If you know of someone who could benefit from our experience, please let us know. You can learn more about us at www.jvlwealth.com. Feel free to pass the link along.
Jerry VanderLugt CPA, CFP, CVA
Matthew Kunnen, CFA, CFP
Chad Soukup, CPA, CFP
 

REFERENCES:


[1] Information obtained from Morningstar Direct: Various U.S. Indexes Total Return
[2] Information obtained from Morningstar Direct: Various U.S. Sectors Total Return
[3] Information obtained from Morningstar Direct: Various Foreign Indexes Total Return
[4] Information obtained from Morningstar Direct: S&P 500 Price Return
[5] Information obtained from Morningstar Direct: S&P 500 Price Return
[6] Information obtained from Morningstar Direct: S&P 500 Total Return
[7] Information obtained from Morningstar Direct: “FRED, Real Gross Domestic Product, Seasonally Adjusted Annual Rate , U.S. Bureau of Economic Analysis, Billions of Chained 2009 Dollars”
[8] Information obtained from the Institute of Supply Management: https://www.quandl.com
[9] Information obtained from Morningstar Direct: “FRED, Capacity Utilization: Total Industry, Seasonally Adjusted , Board of Governors of the Federal Reserve System (US), Percent of Capacity”
[10] Information obtained from United States Census Bureau website: https://www.census.gov
[11] Information obtained from Morningstar Direct: “FRED, All Employees: Total Nonfarm Payrolls, Seasonally Adjusted , U.S. Bureau of Labor Statistics, Thousands of Persons”
[12] Information obtained from https:www.portalseven.com & Morningstar Direct: “FRED, Civilian Unemployment Rate, Seasonally Adjusted, U.S. Bureau of Labor Statistics, Percent” & “FRED, All Employees: Total Nonfarm Payrolls, Seasonally Adjusted , U.S. Bureau of Labor Statistics, Thousands of Persons”
[13] Information obtained from the U.S. Bureau of Labor Statistics website: https://www.bls.gov
[14] Information obtained from Morningstar Direct: “FRED, Housing Starts: Total: New Privately Owned Housing Units Started, Seasonally Adjusted Annual Rate , U.S. Bureau of the Census, Thousands of Units” & “FRED, Privately Owned Housing Starts: 1-Unit Structures, Seasonally Adjusted Annual Rate , U.S. Bureau of the Census, Thousands of Units”
[15] Information obtained from Morningstar Direct: “FRED, Existing Home Sales, Seasonally Adjusted Annual Rate , National Association of Realtors, Number of Units”
[16] Information obtained from Federal Reserve Bank of St. Louis: 30-Year Fixed Rate Mortgage Average in the United States, Percent, Weekly, Not Seasonally Adjusted
[17] Information obtained from S&P Dow Jones Indices website: http://us.spindices.com/index-family/real-estate/sp-corelogic-case-shiller
[18] Information obtained from University of Michigan Survey of Consumers web site: http://www.sca.isr.umich.edu
[19] Information obtained from United States Census Bureau website: https://www.census.gov
[20] Information obtained from Morningstar Direct: “FRED, Total Vehicle Sales, Seasonally Adjusted Annual Rate , U.S. Bureau of Economic Analysis, Millions of Units”
[21] Information obtained from Federal Reserve Bank of New York website: https://apps.newyorkfed.org/ & Morningstar Direct: “FRED, 10-Year Treasury Constant Maturity Rate, Not Seasonally Adjusted, Board of Governors of the Federal Reserve System (US), Percent
[22] Information obtained from Morningstar Direct: “FRED, Consumer Price Index for All Urban Consumers: All Items Less Food and Energy, Seasonally Adjusted , U.S. Bureau of Labor Statistics, Index 1982-1984=100” & “FRED, Consumer Price Index for All Urban Consumers: All Items, Seasonally Adjusted , U.S. Bureau of Labor Statistics, Index 1982-1984=100”
[23] Information obtained from Morningstar Direct: Brent Crude Price
[24] Information obtained from Federal Reserves Bank of St. Louis website: https://fred.stlouisfed.org/
[25] Information obtained from S&P Dow Jones Indices website: http://us.spindices.com/indices/equity/sp-500
[26] Information obtained from S&P Dow Jones Indices website: http://us.spindices.com/indices/equity/sp-500
[27] Information obtained from Investing.com website: https://www.investing.com/rates-bonds/